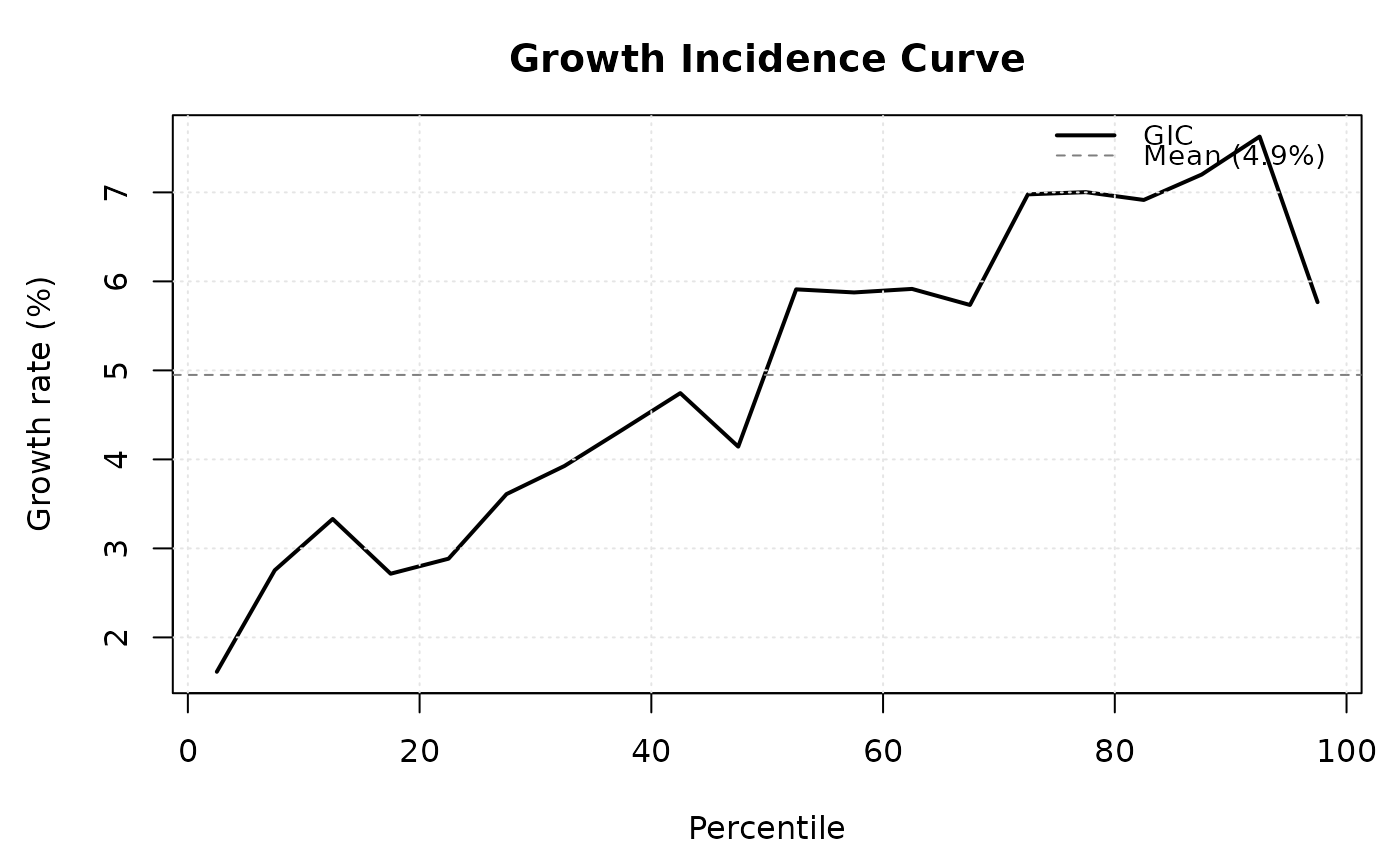
Computes the growth incidence curve (GIC), showing the annualised or total growth rate at each quantile of the distribution between two time periods.
Usage
iq_growth_incidence(
  x_t0,
  x_t1,
  weights_t0 = NULL,
  weights_t1 = NULL,
  n_quantiles = 20L,
  na.rm = FALSE
)
Arguments
- x_t0
Numeric vector of incomes in period 0.
- x_t1
Numeric vector of incomes in period 1. Must be the same length as
x_t0.- weights_t0
Optional weights for period 0.
- weights_t1
Optional weights for period 1.
- n_quantiles
Integer. Number of quantile bins. Default
20(ventiles).- na.rm
Logical. Remove
NAvalues? DefaultFALSE.
Value
An S3 object of class "iq_growth_incidence" with elements:
- gic
data.frame with columns
quantile(midpoint),growth(proportional growth rate at that quantile).- mean_growth
Numeric. Mean growth across all quantiles.
- median_growth
Numeric. Median growth rate.
- n_quantiles
Integer.
Details
If the GIC is upward-sloping, the rich grew faster and inequality increased. If downward-sloping, growth was pro-poor.
References
Ravallion, M. and Chen, S. (2003). "Measuring Pro-Poor Growth." Economics Letters, 78(1), 93–99.
Examples
d <- iq_sample_data("panel")
gic <- iq_growth_incidence(d$income_t0, d$income_t1)
plot(gic)