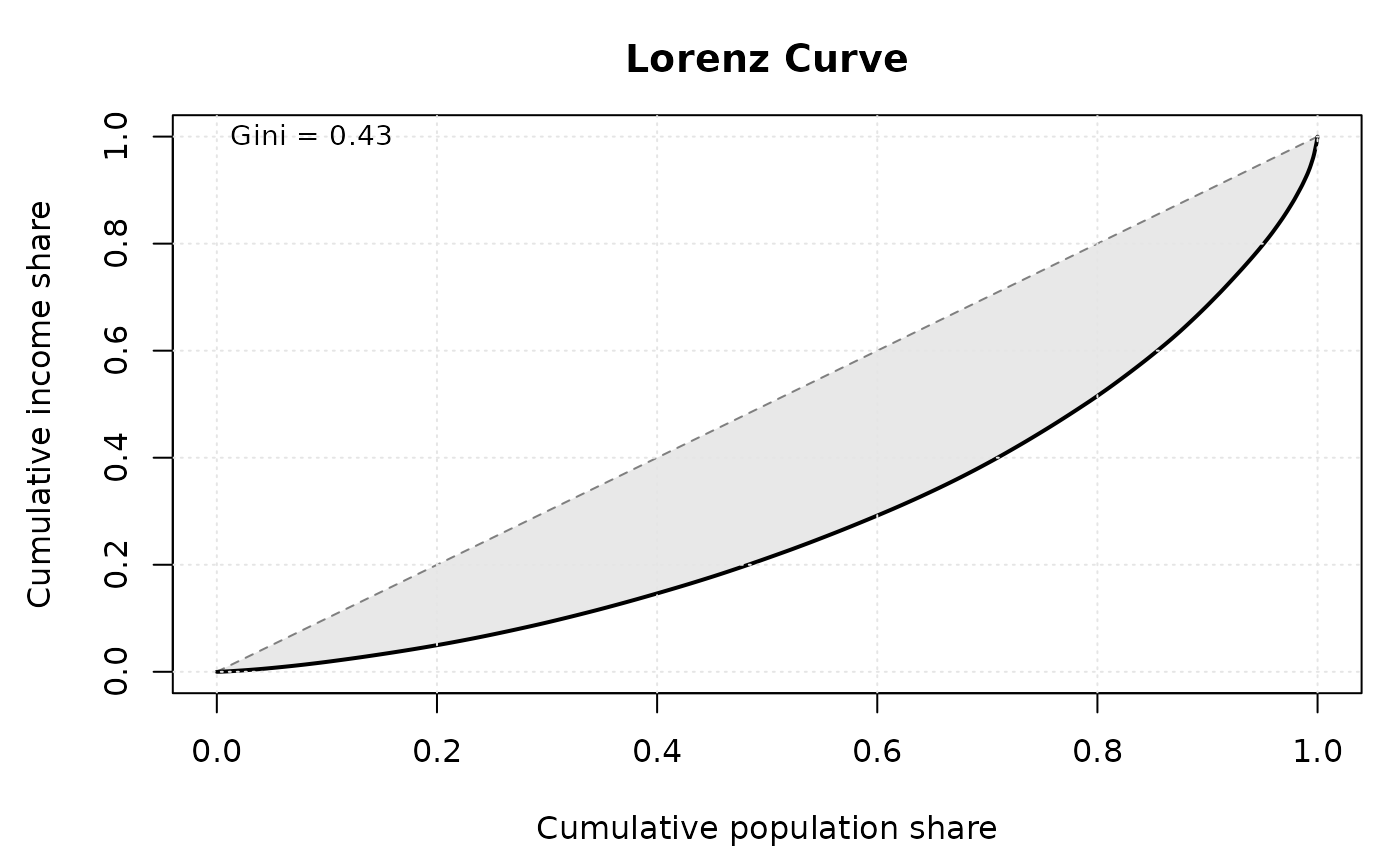
Computes the Lorenz curve: the cumulative share of income held by the
cumulative share of the population, ordered from poorest to richest.
The result can be plotted with plot().
Value
An S3 object of class "iq_lorenz" with elements:
- curve
data.frame with columns
cum_popandcum_income(both 0 to 1). Starts at (0, 0) and ends at (1, 1).- gini
Numeric. The Gini coefficient (twice the area between the curve and the diagonal).
- n
Integer. Number of observations.
References
Lorenz, M. O. (1905). "Methods of Measuring the Concentration of Wealth." Publications of the American Statistical Association, 9(70), 209–219.
Examples
d <- iq_sample_data("income")
lc <- iq_lorenz(d$income)
plot(lc)