Decompose inflation into sticky and flexible components
Source:R/sticky_flexible.R
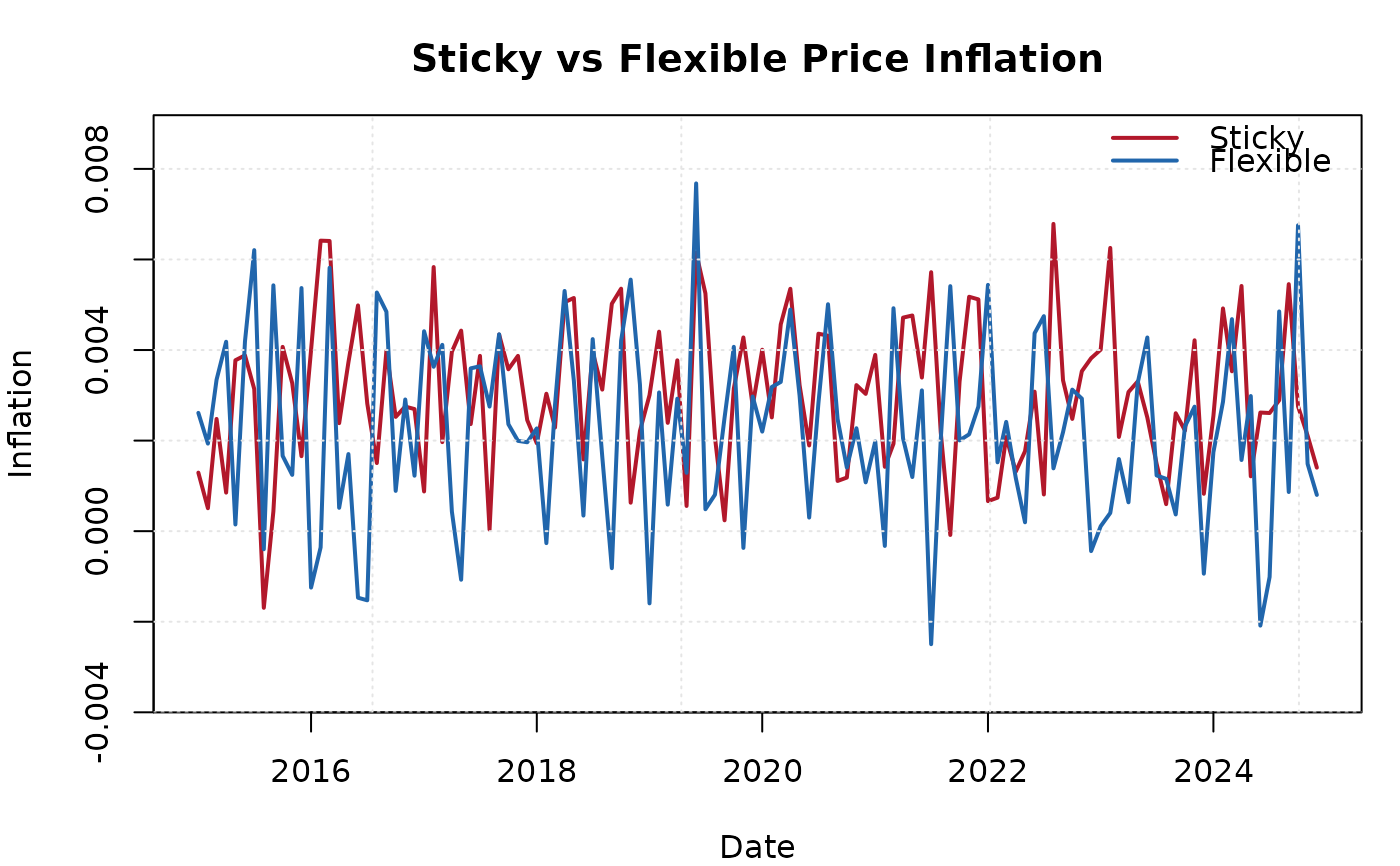
ik_sticky_flexible.RdSplits CPI components into sticky-price and flexible-price categories based on a user-provided classification, then computes separate weighted inflation measures for each group. This follows the Atlanta Fed methodology.
Usage
ik_sticky_flexible(
  data,
  classification,
  date_col = "date",
  item_col = "item",
  change_col = "price_change",
  weight_col = "weight"
)
Arguments
- data
A data.frame containing component-level inflation data.
- classification
A named logical vector or a data.frame. If a named logical vector, names correspond to item names and
TRUEindicates sticky. If a data.frame, it must have columnsitem(character) andsticky(logical).- date_col
Character. Name of the date column. Default
"date".- item_col
Character. Name of the item/component column. Default
"item".- change_col
Character. Name of the price change column. Default
"price_change".- weight_col
Character. Name of the weight column. Default
"weight".
Value
An S3 object of class "ik_sticky_flex" with elements:
- result
data.frame with columns: date, sticky, flexible, headline.
- classification
Named logical vector mapping items to sticky/flexible.
References
Bils, M. and Klenow, P. J. (2004). "Some Evidence on the Importance of Sticky Prices." Journal of Political Economy, 112(5), 947-985.
Examples
data <- ik_sample_data("components")
# Classify items
class_vec <- c(
  Food = FALSE, Housing = TRUE, Transport = FALSE,
  Clothing = FALSE, Health = TRUE, Education = TRUE,
  Communication = TRUE, Recreation = FALSE,
  Restaurants = TRUE, Other = FALSE
)
sf <- ik_sticky_flexible(data, classification = class_vec)
print(sf)
#>
#> ── Sticky vs Flexible Price Inflation ──────────────────────────────────────────
#> • Sticky items: 5
#> • Flexible items: 5
#> • Mean sticky inflation: 0.3%
#> • Mean flexible inflation: 0.23%
#> • Correlation: -0.042
#> • Observations: 120
plot(sf)