Creates a two-panel base R plot. The top panel shows prediction intervals over time; the bottom panel shows the adaptive alpha trace.
Usage
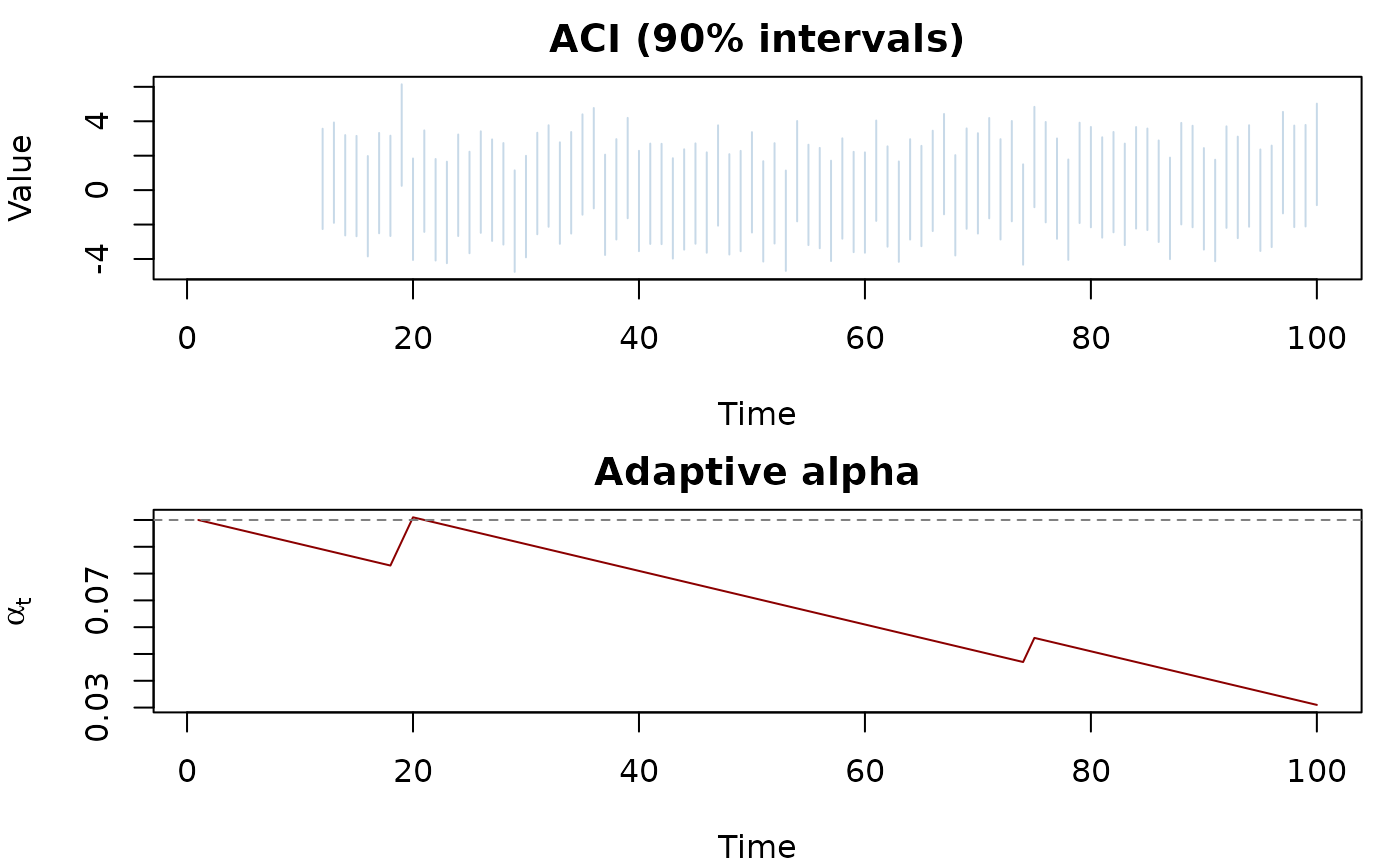
# S3 method for class 'predictset_aci'
plot(x, max_points = 500, ...)Creates a two-panel base R plot. The top panel shows prediction intervals over time; the bottom panel shows the adaptive alpha trace.
# S3 method for class 'predictset_aci'
plot(x, max_points = 500, ...)