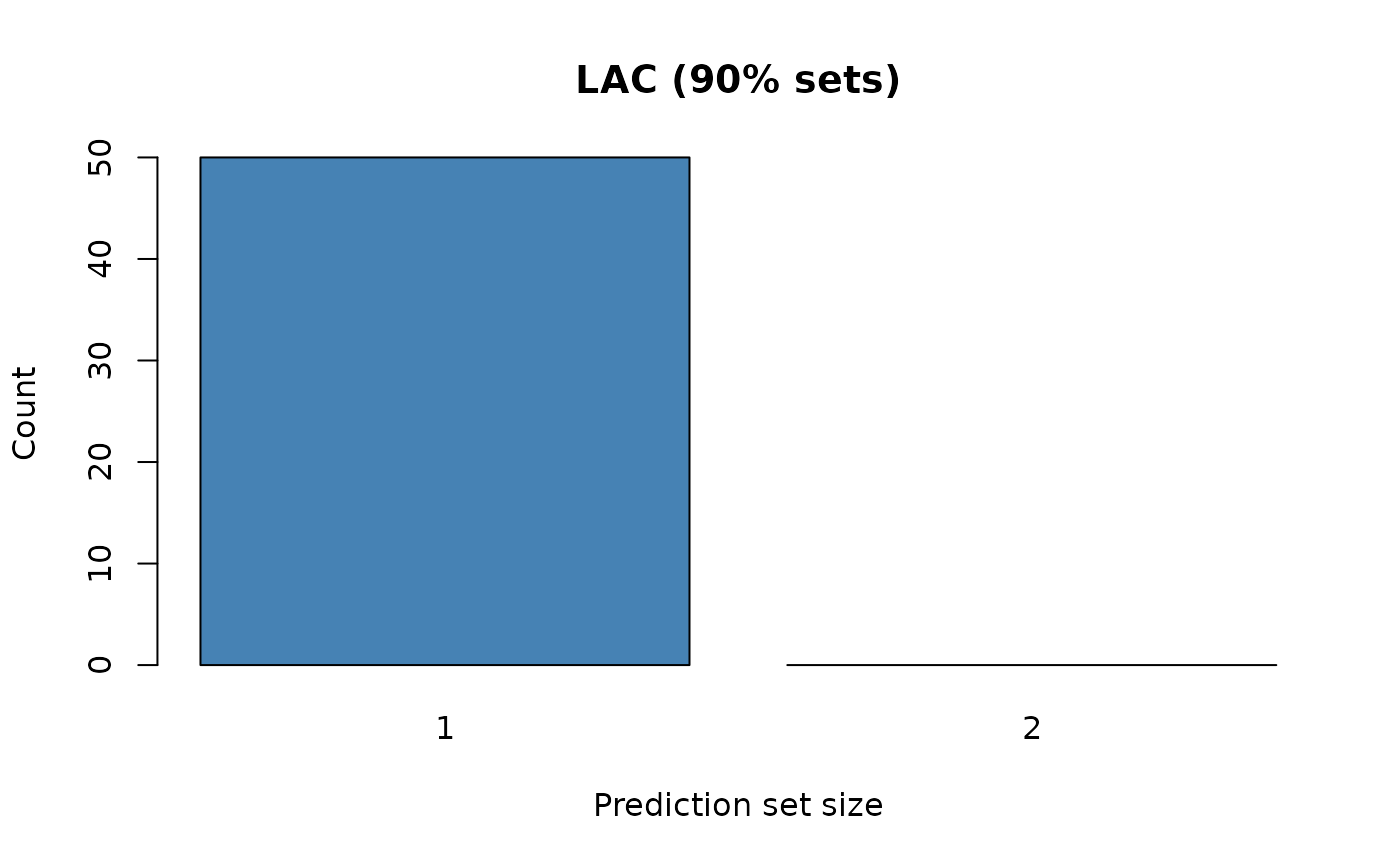
Creates a barplot showing the distribution of prediction set sizes.
Usage
# S3 method for class 'predictset_class'
plot(x, ...)
Arguments
- x
A
predictset_classobject.- ...
Additional arguments passed to
barplot().
Examples
set.seed(42)
n <- 300
x <- matrix(rnorm(n * 4), ncol = 4)
y <- factor(ifelse(x[,1] > 0, "A", "B"))
x_new <- matrix(rnorm(50 * 4), ncol = 4)

clf <- make_model(
  train_fun = function(x, y) glm(y ~ ., data = data.frame(y = y, x),
                                  family = "binomial"),
  predict_fun = function(object, x_new) {
    df <- as.data.frame(x_new)
    names(df) <- paste0("X", seq_len(ncol(x_new)))
    p <- predict(object, newdata = df, type = "response")
    cbind(A = 1 - p, B = p)
  },
  type = "classification"
)

result <- conformal_lac(x, y, model = clf, x_new = x_new)
#> Warning: glm.fit: algorithm did not converge
#> Warning: glm.fit: fitted probabilities numerically 0 or 1 occurred
plot(result)