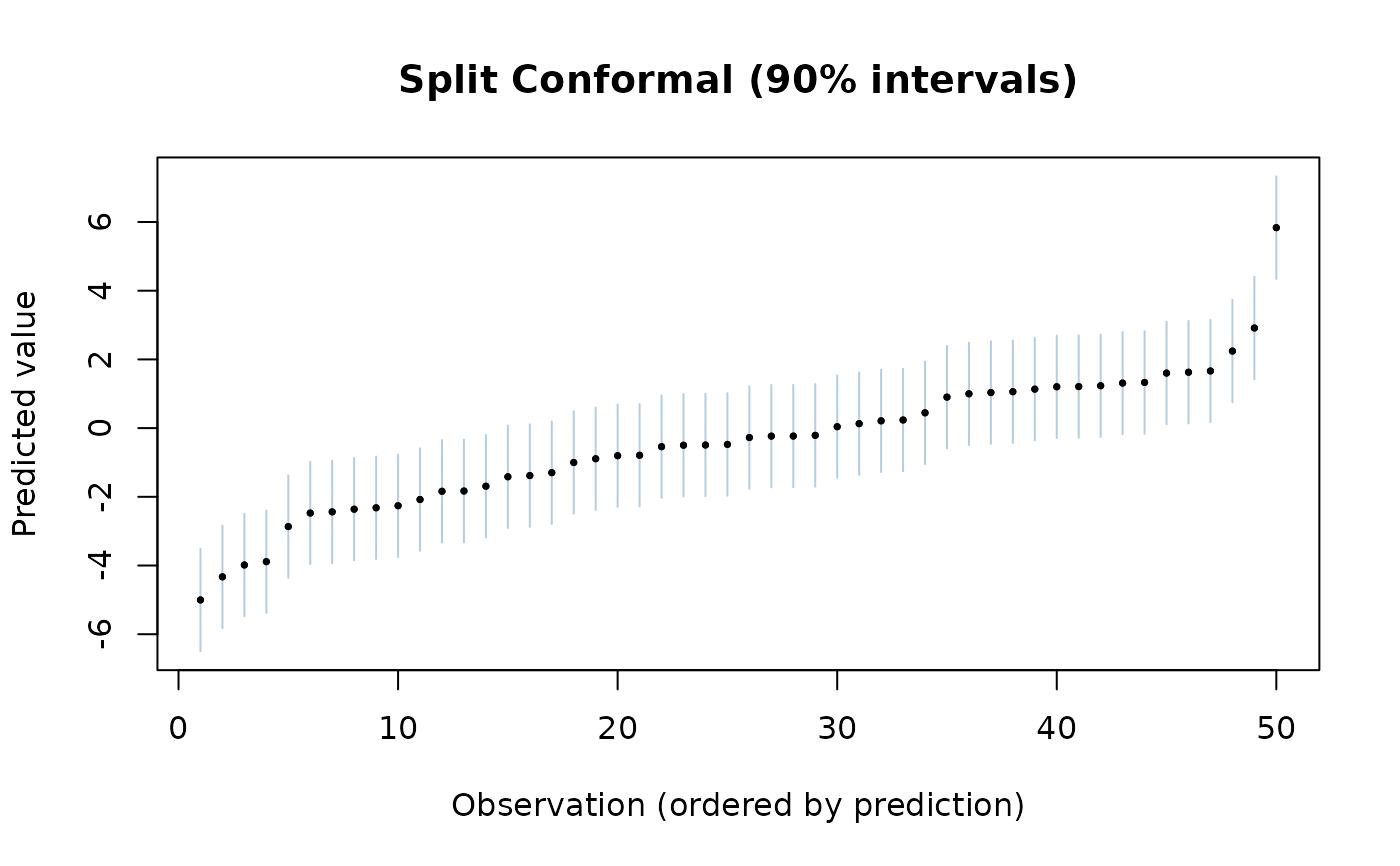
Creates a base R plot showing prediction intervals. Points are ordered by predicted value, with intervals shown as vertical segments.
Usage
# S3 method for class 'predictset_reg'
plot(x, max_points = 200, ...)
Arguments
- x
A
predictset_regobject.- max_points
Maximum number of points to display. Default
200. If there are more predictions, a random subset is shown.- ...
Additional arguments passed to
plot().